
The situation
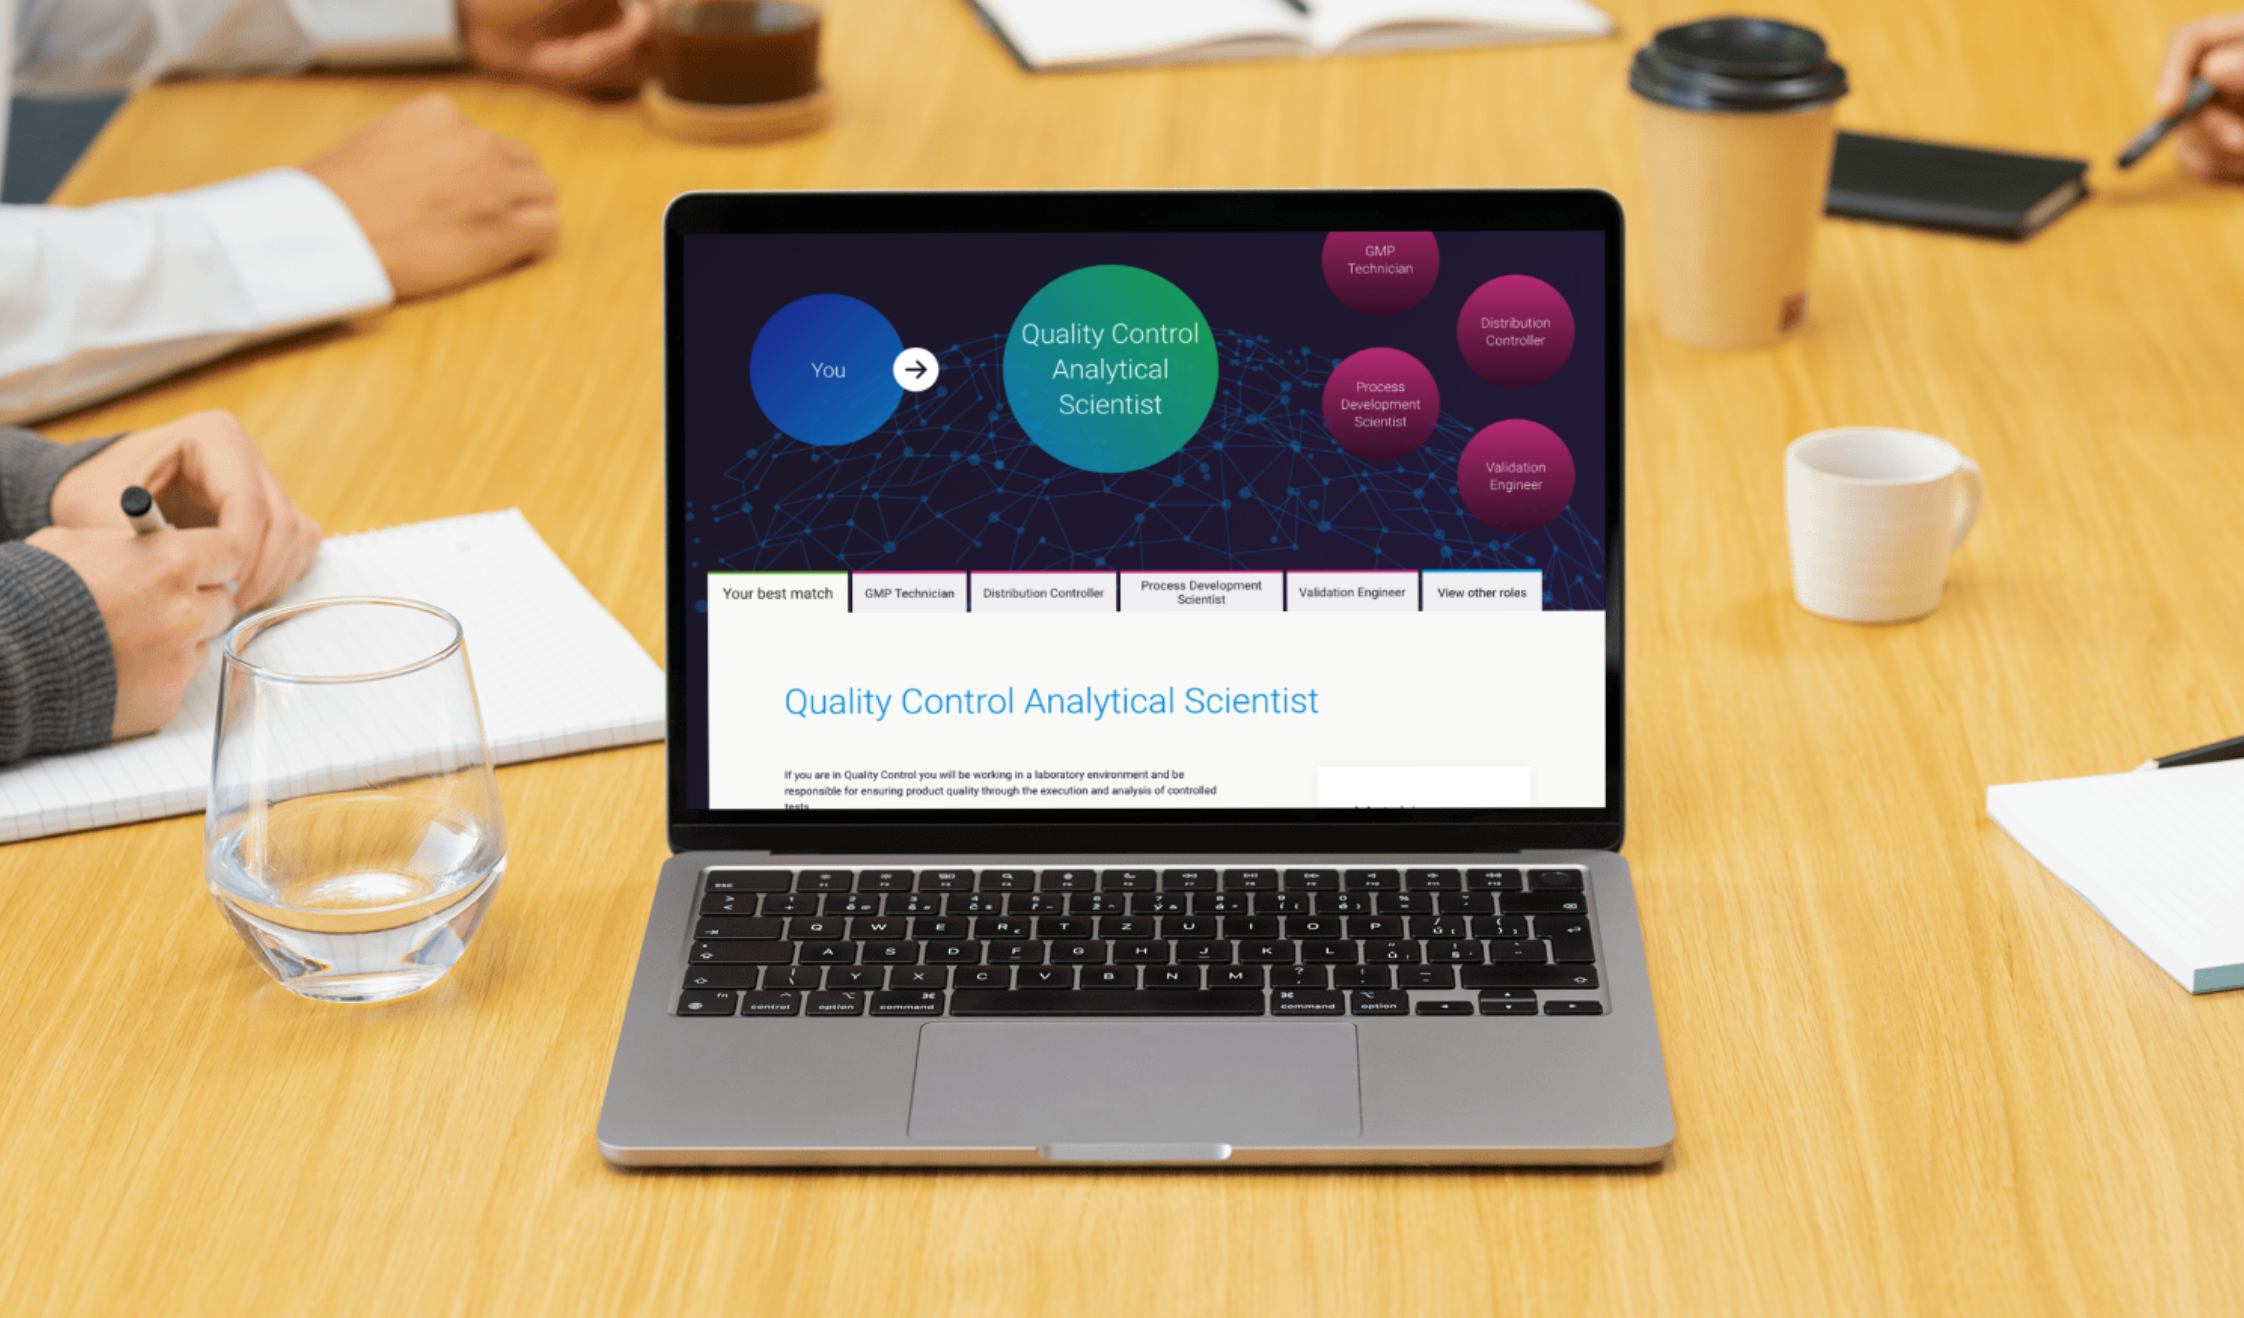
Enginuity had gathered the data to compare careers in vaccine manufacturing, a growing sector with real opportunities for people changing careers. The challenge was presenting complex data so that someone without a technical background could see how their current skills might transfer.
What we questioned first
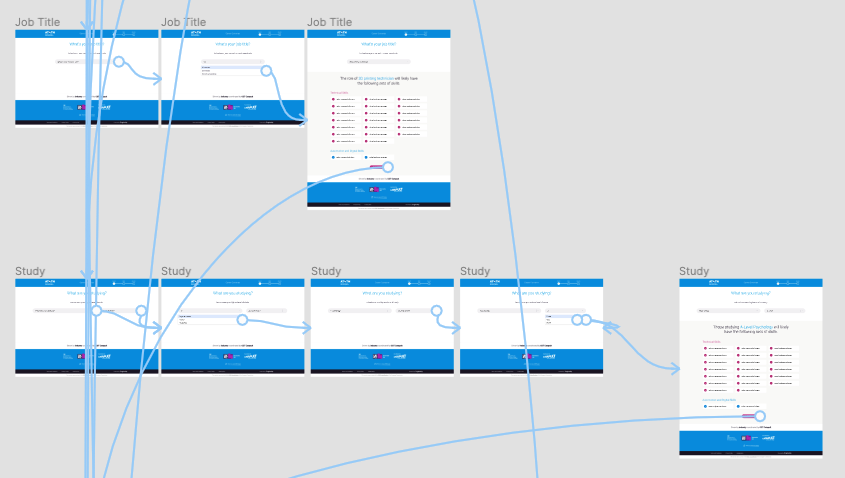
- Will people get it?Interactive Figma prototypes let stakeholders try the flows early, so problems were found and fixed before development started.
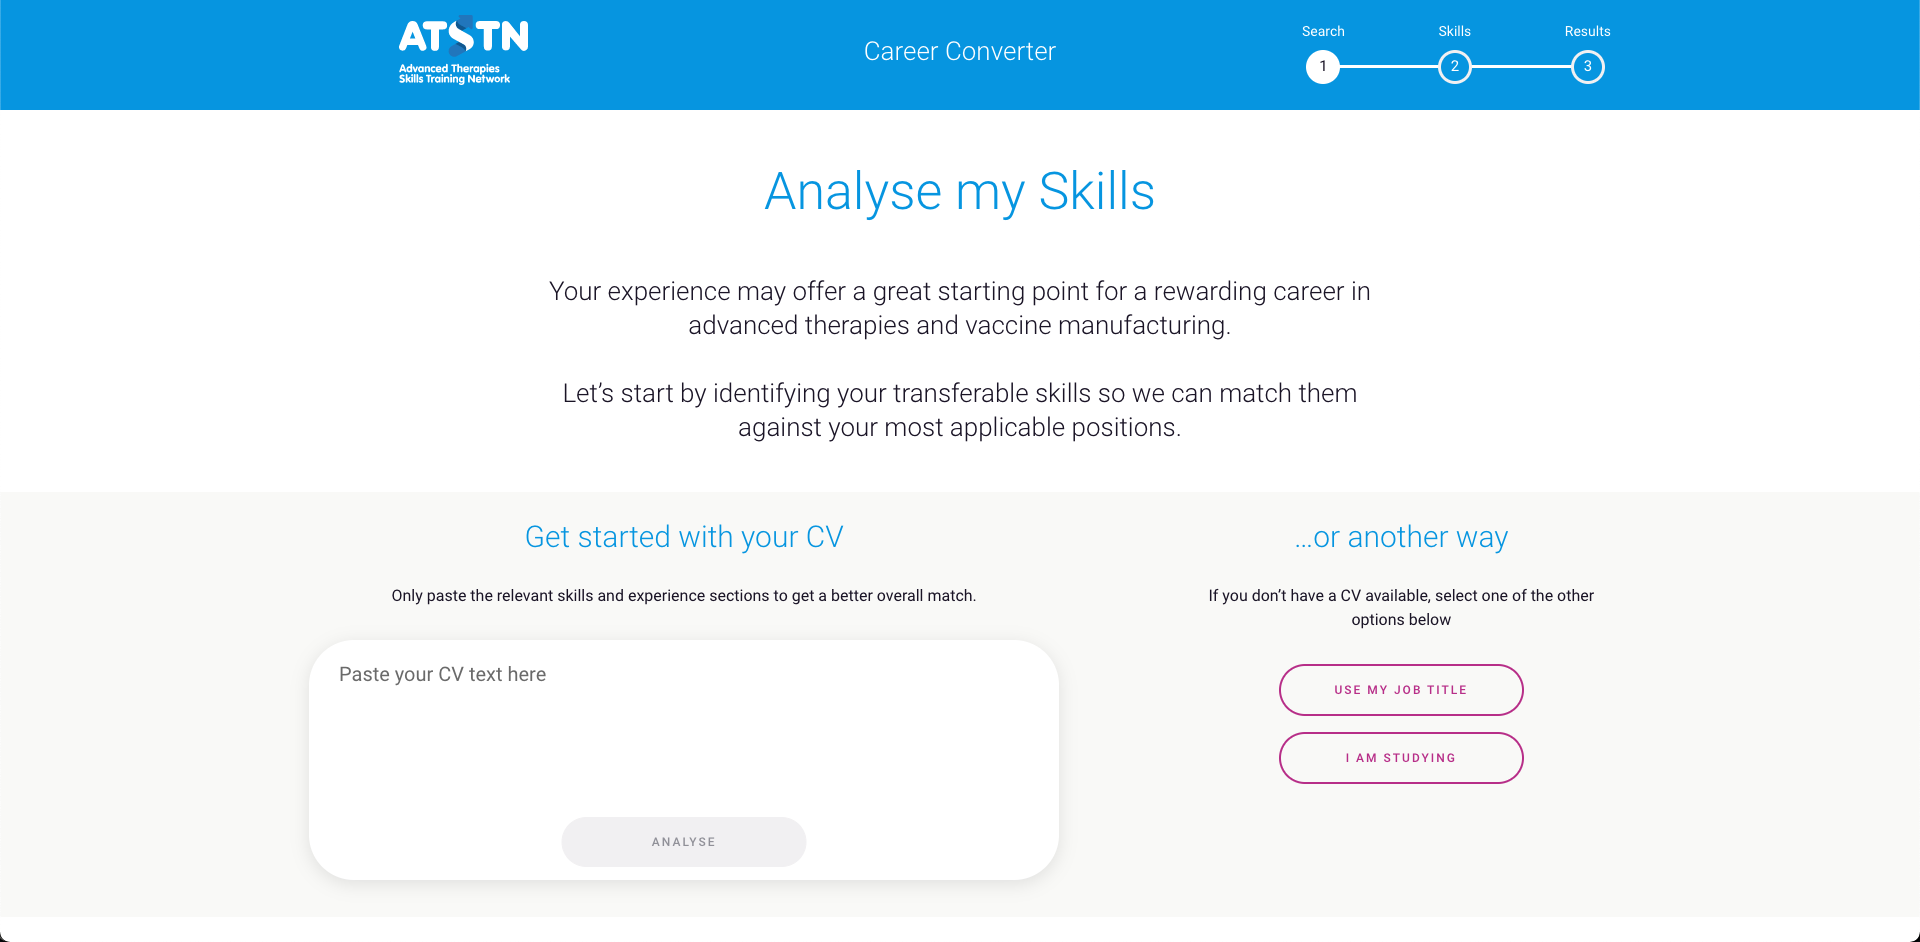
- Should it feel new or familiar?Familiar. We used Enginuity’s established design language so it sits naturally alongside its other platforms.
- What if demand grows?A modular back end that can scale each part independently as traffic and data grow.
What we built
An interactive web application with a simple, guided interface over sophisticated matching, built on .NET Core microservices on Azure with CosmosDB and Kubernetes.
What changed
The platform launched on time and within budget and has been well received for its clarity and ease of use, helping people see a route into a sector that needs them.
How we’d work on this today. Hiding complex data behind a simple screen is a design decision, and the fractional team makes decisions like it on every request in the queue. For education and skills